

Recent Sales in Bonnymede & Montecito Shores
Click to enlarge the following graphics showing the location of sales within Bonnymede & Montecito Shores:
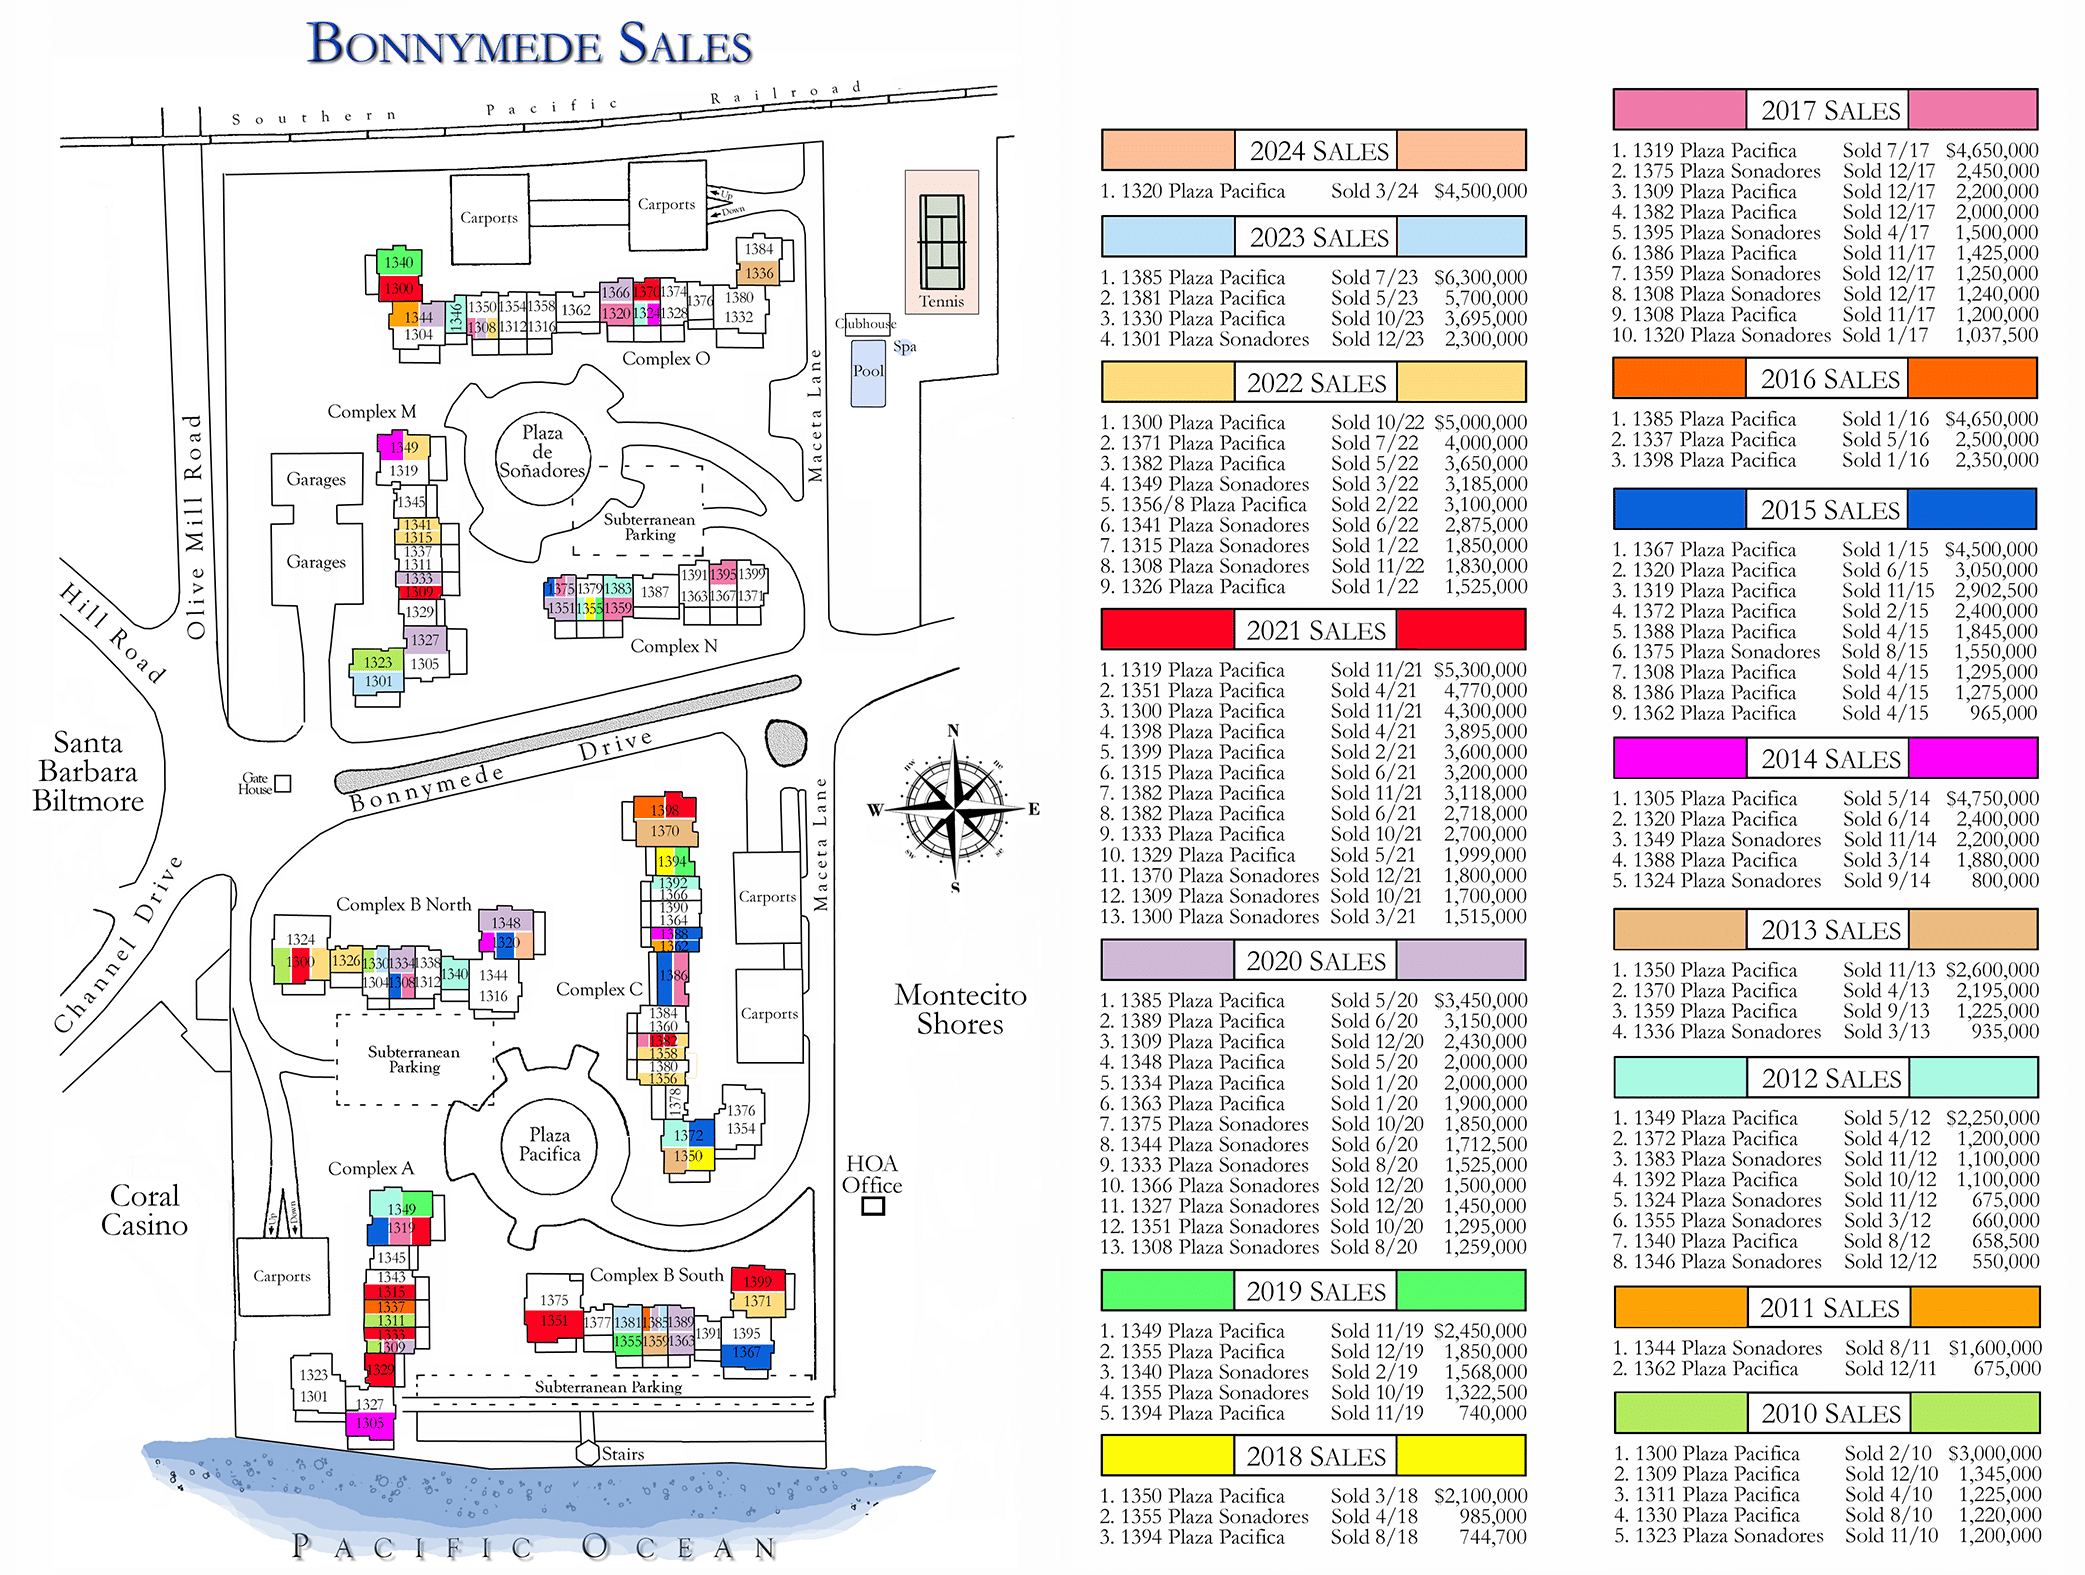
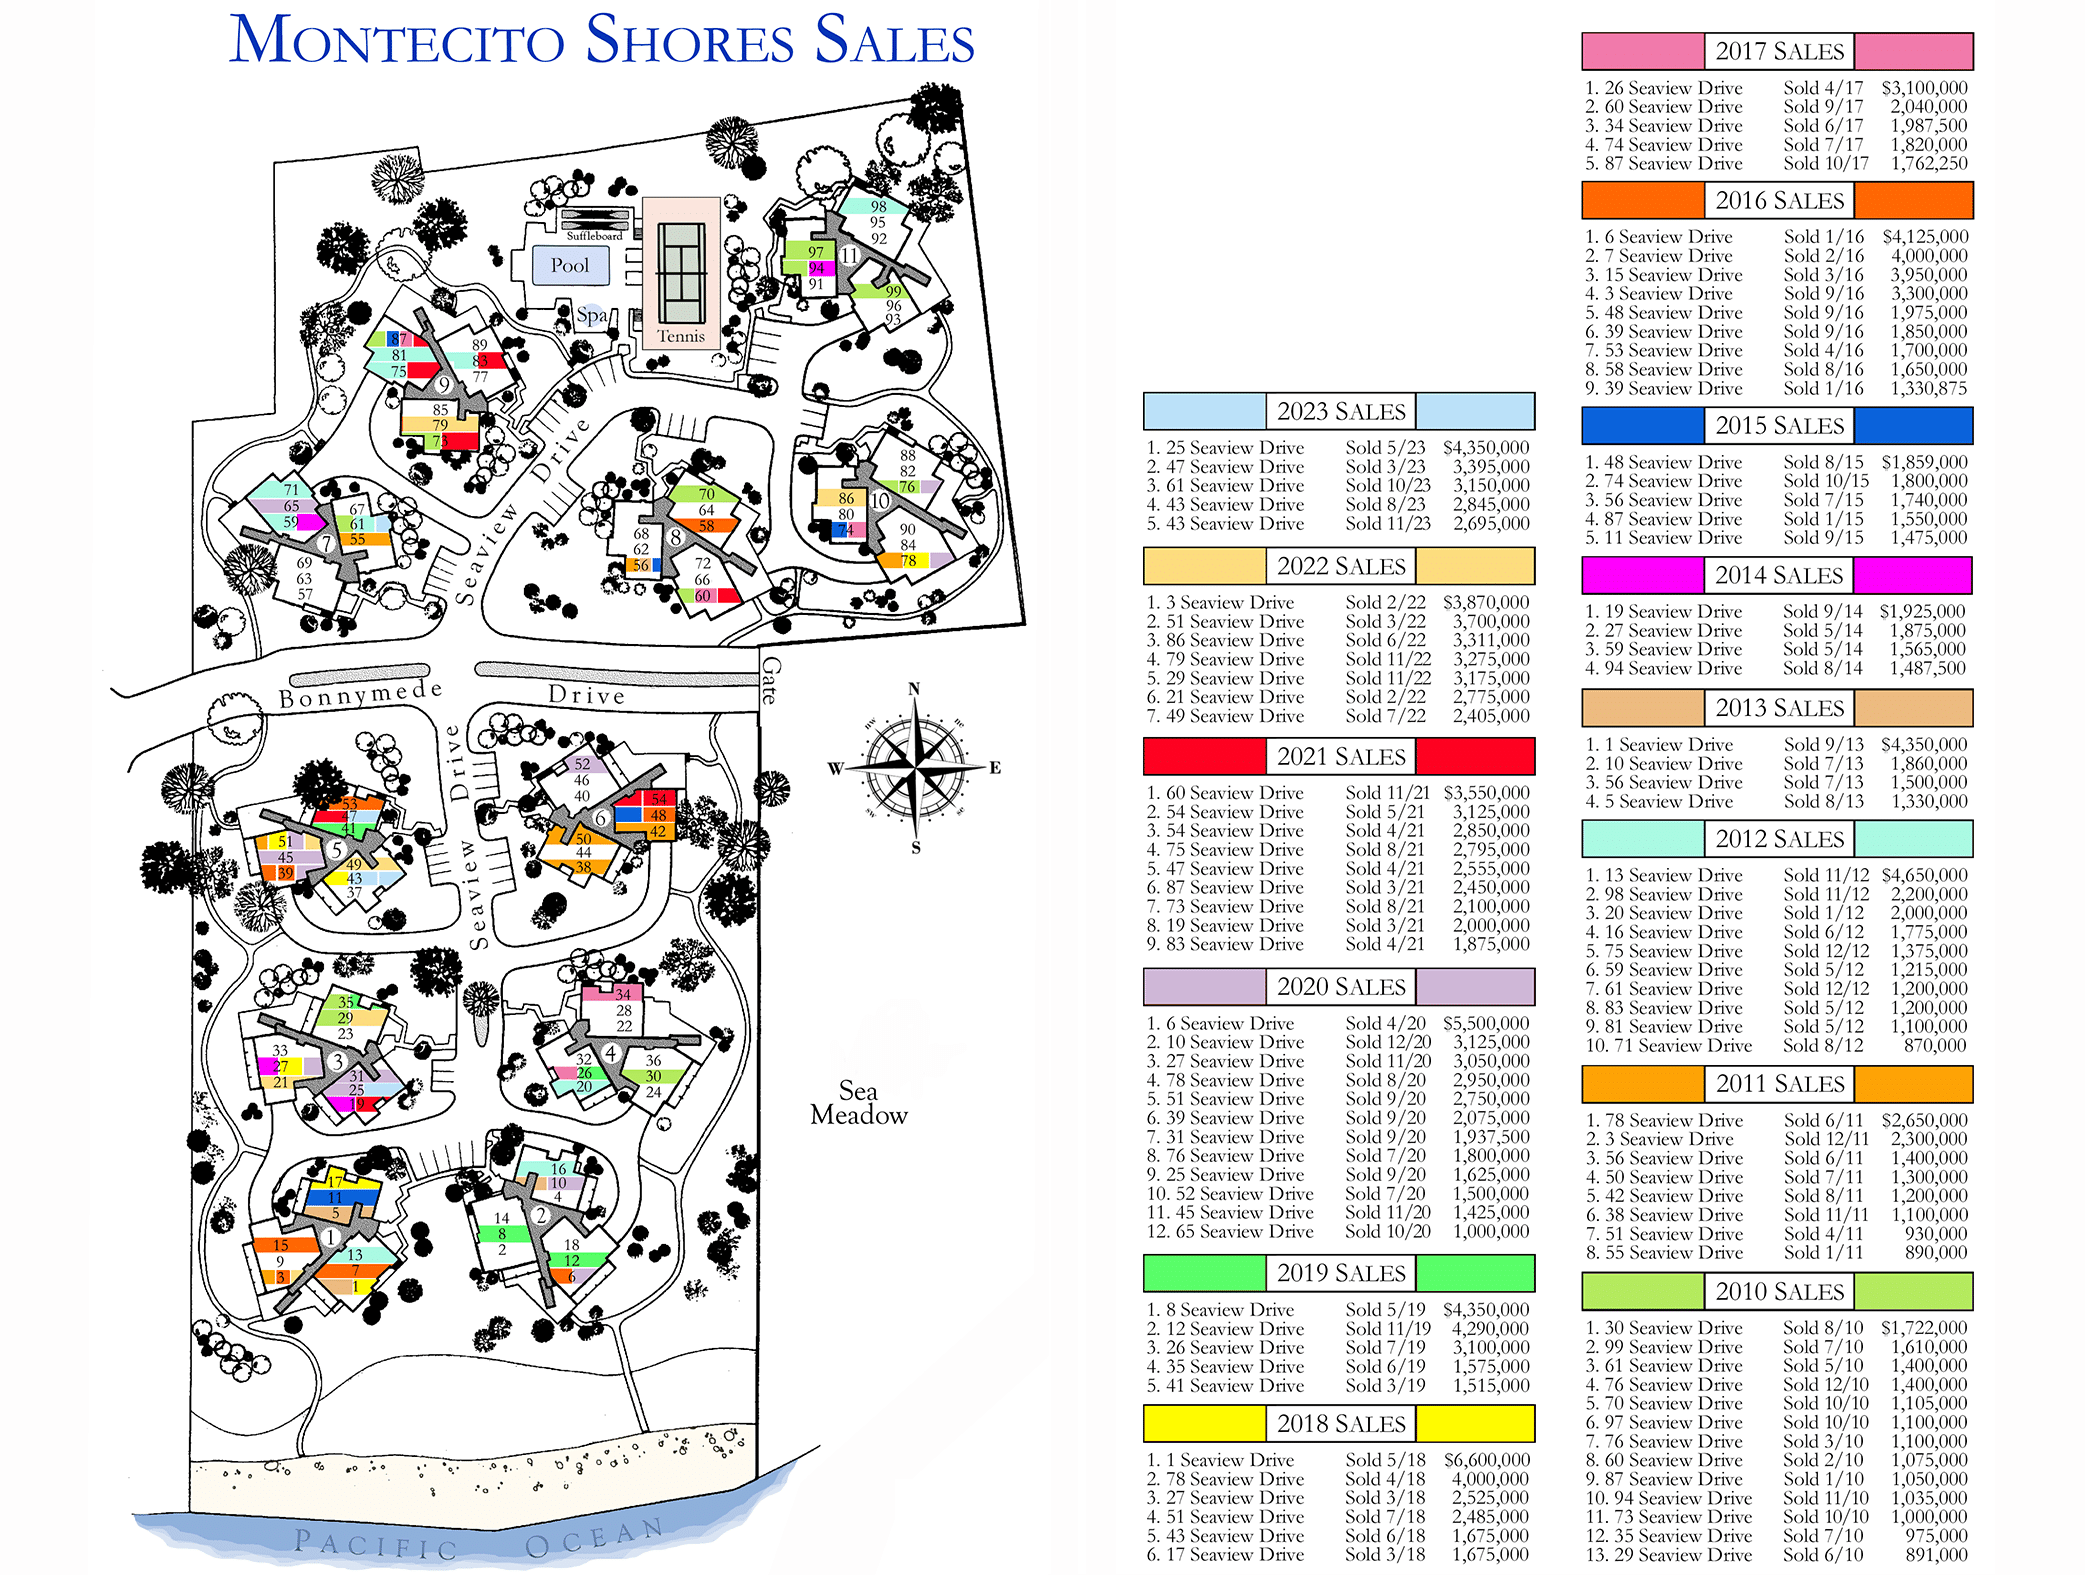
The graphics above show all of the sales within Bonnymede & Montecito Shores in recent years. The unit numbers are color coded to the year in which they sold. Certain condos have sold more than once during this time, so they appear multi-colored. This makes it easy to track their values over time.
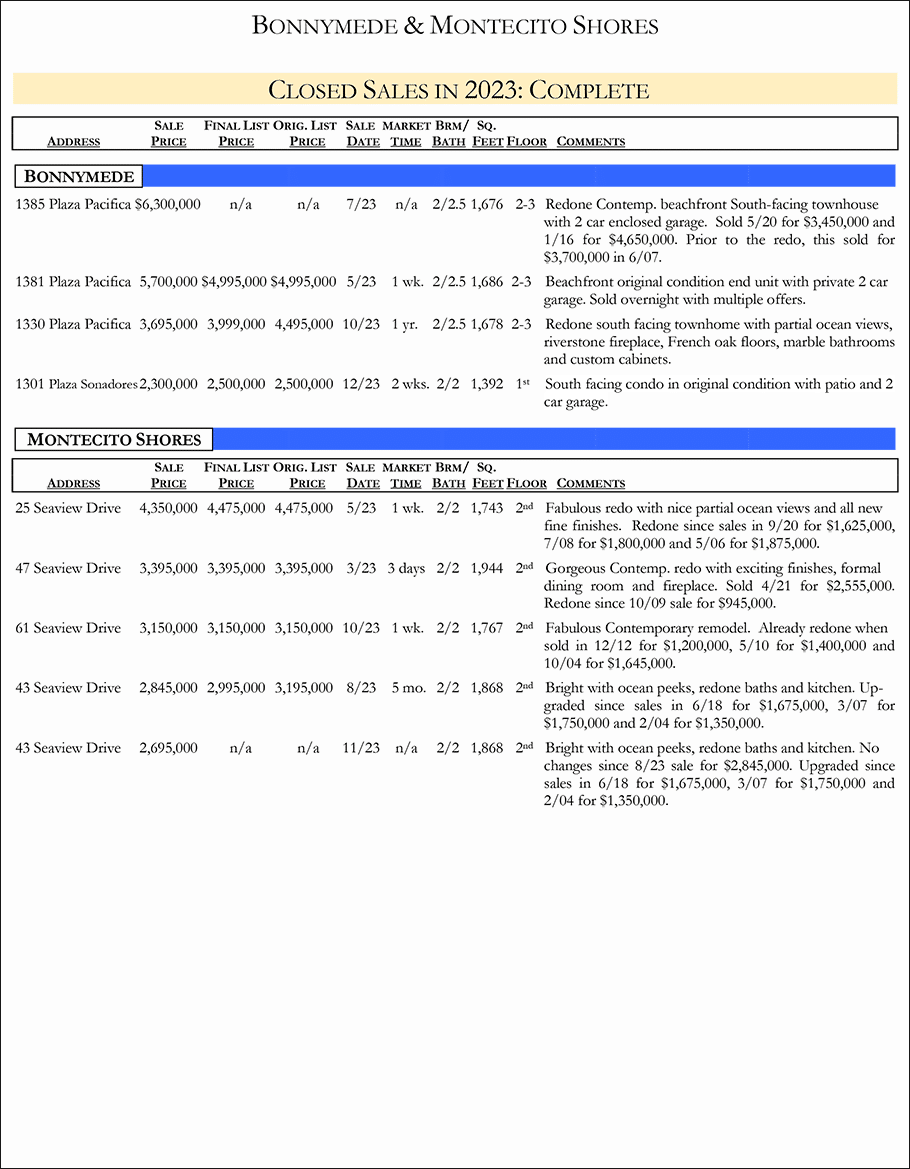
Click on the following graphic to display a PDF with information regarding all the sales within Bonnymede & Montecito Shores since 2000 organized by price.
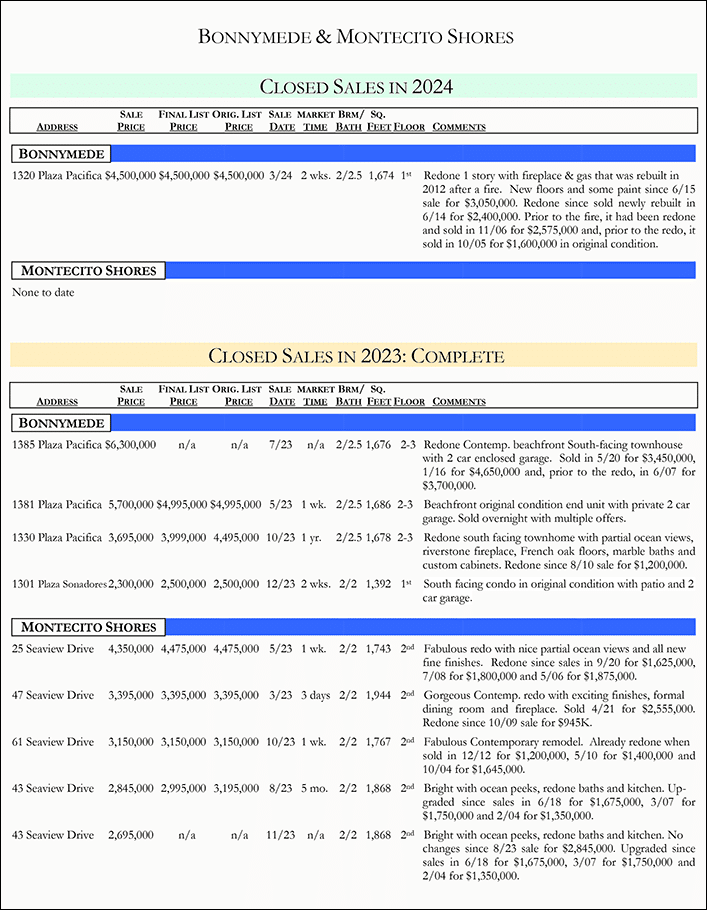
Click on the following graphic to display a PDF with information regarding all the sales within Bonnymede & Montecito Shores since 2000 organized by year of sale.
156 Matches Found
$6,300,000
1385 Plaza Pacifica, SANTA BARBARA, CA
Closed
2BD
2.5BA
1,686SF
Last Modified: 11:02pm, July 14, 2023

$5,500,000
6 Seaview Drive, MONTECITO, CA
Closed
2BD
2.5BA
2,258SF
Last Modified: 12:01am, May 7, 2020
$5,300,000
1319 Plaza Pacifica, MONTECITO, CA
Closed
3BD
3BA
2,055SF
Last Modified: 7:17pm, November 19, 2021
$4,750,000
1305 Plaza Pacifica, SANTA BARBARA, CA
Closed
2BD
2.5BA
1,694SF
Last Modified: 11:15pm, April 19, 2019
$4,650,000
1319 Plaza Pacifica, SANTA BARBARA, CA
Closed
3BD
3BA
2,055SF
Last Modified: 4:00pm, April 17, 2019
$5,000,000
1300 Plaza Pacifica, SANTA BARBARA, CA
Closed
3BD
3BA
2,136SF
Last Modified: 3:50pm, September 12, 2023
$4,770,000
1351 Plaza Pacifica, MONTECITO, CA
Closed
3BD
3BA
2,157SF
Last Modified: 10:25pm, April 2, 2021
$4,650,000
13 Seaview Drive, MONTECITO, CA
Closed
3BD
2.5BA
2,670SF
Last Modified: 1:45am, April 20, 2019
$5,700,000
1381 Plaza Pacifica, MONTECITO, CA
Closed
2BD
2.5BA
1,686SF
Last Modified: 5:42pm, May 26, 2023
$4,650,000
1385 Plaza Pacifica, MONTECITO, CA
Closed
2BD
3BA
1,686SF
Last Modified: 5:45pm, April 18, 2019
The data relating to real estate for sale on this web site comes from the Internet Data Exchange Program of the Santa Barbara Multiple Listing Service. Real estate listings held by brokerage firms other than the displaying broker(s) are marked with the 'MLS' logo and detailed information about them includes the name of the listing brokers.
All properties are subject to prior sale, change or withdrawal. Neither listing broker(s) nor displaying broker shall be responsible for any typographical errors, misinformation, or misprints. 2015 Santa Barbara Multiple Listing Service. All rights reserved.